WOAR Clients & Programs Mapped by Zip Code -- Using Python Scripting
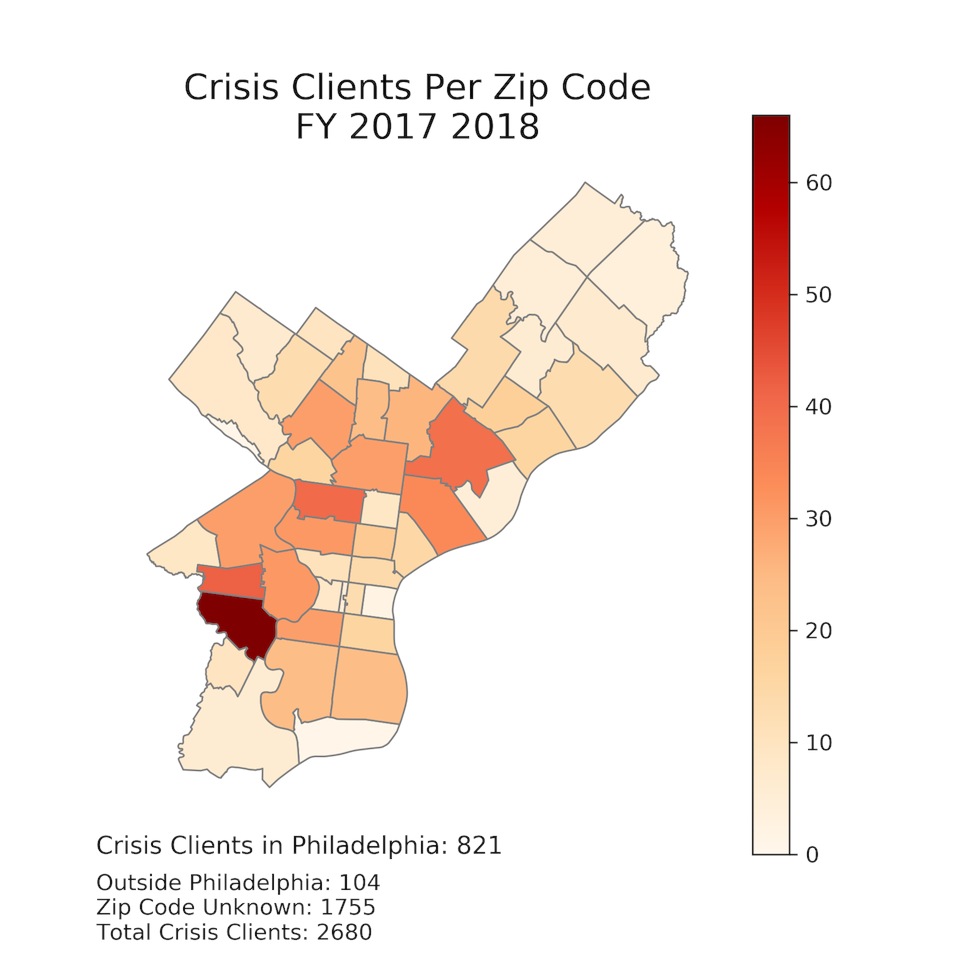


These six maps are examples of the map outputs created by using one of the Python scripts I wrote for WOAR (Philadelphia Center Against Sexual Violence) as part of my capstone project. These maps illustrate WOAR’s raw client and program data for fiscal year 2017-2018.
PROJECT OVERVIEW:
WOAR has many emerging goals and questions regarding data collection and analysis, as it transitions to becoming a more data centered organization. In the initial stages of this project, my supervisor and I decided that WOAR’s first priority should be mapping its own internal data, in order to understand the distribution of its own clients, programs and services across the city of Philadelphia, and to eventually compare that data to other external data sets (such as police crime data, bar and restaurant locations, census based demographic information, etc.).
Therefore, the primary goal of this project is to map the locations of WOAR programs and services across Philadelphia by zip code, using Python scripting. The five main categories of WOAR services mapped in this project are the following: therapy services, crisis services, forensic rape exam accompaniment, education programs and outreach programs. The therapy, crisis and forensic exam services are mapped using the zip code where the client resides. The education and outreach programs are mapped using the zip code where the program is given.
I chose Python for this project for a few reasons. First, WOAR does not have any GIS or data software infrastructure. Therefore, it was important to use a free, open source platform that would function efficiently with no financial investment and very little investment of staff time. Second, Python is capable of doing both data manipulation and mapping, both of which were very necessary components of this project.
To map these services, I created two workflows, one that can be repeated monthly and one that can be repeated yearly. Each creates six maps, three CSVs and one shapefile. The workflows are semi-automated. The beginning of the process, specifically the data preparation, must be done manually using a combination of WOAR’s ETO database and Microsoft Excel. Once the data is prepared correctly, an automated Python script inputs and manipulates the data. The script exports five choropleth maps as .PNG files, each displaying the geographic data for one of WOAR’s five service categories, and a sixth dot-density map showing all five service types on one map. In addition, these workflows produce a CSV containing the number of therapy clients, crisis clients, FRE clients, outreach programs, and education programs per zip code in Philadelphia, as well as a shapefile of Philadelphia zip codes with the same client and program data attached.
It is my intention that these scripts will provide WOAR with consistent geographical data of their own services over time, on a monthly and yearly basis. It is my hope that this information will allow WOAR to analyze its geographical impact on the city, identify patterns in its services, strategize about its impacts, and investigate spatial relationships between internal programs and external data.
– Jenny Roe Sawyer, December 2018
Up Next: